
José Lourenço, Principal Investigator at Ciências ULisboa, published a new paper in [Nature] Scientific Data, on which the authors map the current and future transmission potential of dengue virus transmitted by Aedes aegypti mosquitoes from 1981 to 2019. These results are now available online and can contribute to the planning of disease control and prevention strategies.
What was the starting point that led to the current research?
Taishi Nakase, the MSc student from the University of Oxford was interested in doing his thesis in something related to mosquito-borne viruses. For many years my research team had been using a suitability measure called “index P” to infer the transmission potential of viruses such as dengue, chikungunya, Zika or West Nile. However, past work had been very restricted to small temporal windows and specific locations. Choosing the dengue virus as our model system, we put both of our interests together and planned to explore the suitability measure both within a time window of decades and at a global scale.
What is the main finding reported in this paper?
This paper is mostly dedicated at describing the wealth of data that we generated and how it can be accessed freely online by anyone. Along the way we present case-studies that validate some of the generated data, but in essence, it is a data paper. This is why it was published in Nature Scientific Data.
Why is it important for the scientific community and for society at large?
It provides the scientific community with a vast database of retrospective data that can be used to explore topics of current public health interest, such as where and how has climate-change most affected the potential for the dengue virus to cause outbreaks. We also make available a free to use R-package that offers a variety of functions to estimate and explore the suitability measure index P.
What are the next steps?
Together with colleagues from the international consortium CLIMADE we are exploring the wealth of data in the dataset we created to fully describe the effects of climate-change over the past 40 years on this host-pathogen system.
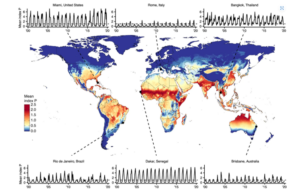
Figure [from the paper] | This map tries to summarize the large spatio-temporal dataset generated and made freely available to the community in this research article. It shows a summary (mean) of the transmission potential of the dengue virus over the past 40 years across the globe. It also shows the time series data for 6 locations corresponding to 6 cities (restricted to the last 20 years for visualization purposes). Each pixel in the map has its own time series data (pixels represent a 28 squared kilometer area).
Find out more about José Lourenço’s research here.
Read the full paper here.